
The use of Z-score models can help you to evaluate the financial credibility of companies, whether they are buyers or suppliers. Completing such risk assessments is of particular importance for your company, especially if your revenue earning capabilities is dependent on a limited number of buyers or suppliers. In addition, with an increase in business insolvencies worldwide, as a result of Covid19, the need to complete financial credibility checks should not be taken for granted when you’re doing business with long-term buyers and suppliers.
The need to complete financial credibility checks should not be taken for granted
Importance of doing financial credibility checks as a Buyer
So, as a corporate buyer, why is it important for you to assess the financial stability of your suppliers? Let’s say that you rely on the products you receive from five suppliers, to deliver the products or services you sell onto your own customers. Think about the risk to your own company if you were to learn quite suddenly that one of these key suppliers is bankrupt. It would be highly disruptive, and even catastrophic.
Importance of doing financial credibility checks as a supplier
As a supplier, you too could be at risk if one of your biggest customers goes out of business. No matter what, it’s highly likely to disrupt your business. They could owe you money, which you might be relying on to buy more supplies. So, you’ll need to stop any planned deliveries, and start chasing any unpaid invoices. Furthermore, if your dependence on any such customer is significant, you could see a big dip in your revenue earnings. Hopefully, it won’t mean that you’ll need to close your own business.
So, how can a Z-score model help?
The Altman Z-score model was developed by Edward I Altman. It uses financial ratios to evaluate the likelihood of a company going bankrupt, by pulling together data you obtain from the Balance Sheets and Profit & Loss statements of the company. The Z-score model can provide warnings of the potential bankruptcy of companies 2 to 3 years before they are officially insolvent. It was initially developed in 1968 for publicly listed manufacturing companies.
You should use the Z-score model as a credit management test, to evaluate the financial credibility of companies you do business with, whether they are working with you as new or ongoing buyers or suppliers. It is extremely useful as it gives you advanced notice of any risk that might be lying ahead, so that you can be prompted to mitigate the potential problem pertaining to the particular buyer or supplier. For example, you might want to tighten your control on your debt or credit management practices, and push your team to further develop your supplier and/or buyer options.
Calculating Z-scores
Overview
You can calculate a “Z-score” for each company you interact with. However, you’ll need to apply different criteria for Public versus Private companies.
You can use one of three versions of the Z-score model, depending on the type of company you want to assess, i.e.:
- Publicly Listed Manufacturing company.
- Privately Owned Manufacturing company.
- Privately Owned Non-Manufacturing company.
The first version uses the original 1968 calculation developed by Edward I Altman. The last two versions evolved over time to incorporate privately owned companies and non-manufacturing companies.
The formula for each is identified below.
1. Z-Score Model for a Publicly Listed Manufacturing Company
The formula for calculating the z-score for a publicly listed manufacturing company is:
Z = 1.2A + 1.4B + 3.3C + 0.6D + E
where,
A = Net Current Assets / Total Assets
B = Retained Earnings / Total Assets
C = Earnings before Interest & Tax (EBIT) / Total Assets
D = Market Capitalisation / Total Liabilities
E = Total Sales / Total Assets
The score you receive can be analysed as follows:
- >2.99 infers that the company is considered to be “safe”.
- 1.81 – 2.99 infers that the company is experiencing “some risk” of facing financial distress.
- <1.81 infers that the company is at “serious risk” of facing financial distress.
A worked example of this model has been provided further down in this blog, using the financial statements of Carillion PLC.
2. Privately Owned Manufacturing Company
The formula for calculating the z-score for a privately owned manufacturing company is:
Z = 0.717A + 0.847B + 3.107C + 0.43D + 0.998E
where,
A = Working Capital / Total Assets
B = Retained Earnings / Total Assets
C = Earnings before Interest & Tax (EBIT) / Total Assets
D = Book Value of Equity / Total Liabilities
E = Total Sales / Total Assets
The score you receive can be analysed as follows:
- >2.99 infers that the company is considered to be “safe”.
- 1.23 – 2.99 infers that the company is experiencing “some risk” of facing financial distress.
- <1.23 infers that the company is at “serious risk” of facing financial distress.
A worked example of this model has been provided further down in this blog, using the financial statements of a well-known Irish manufacturing company.
3. Privately Owned Non-Manufacturing Company
The formula for calculating the z-score for a privately owned non-manufacturing company is:
Z = 6.56A + 3.26B + 6.72C + 1.05D
where,
A = Working Capital/ Total Assets
B = Retained Earnings/ Total Assets
C = Earnings before Interest & Tax (EBIT)/ Total Assets
D = Book Value of Equity/ Total Liabilities
Note: For privately owned non-manufacturing companies with no working capital (e.g., a purely services business), you can use “Net Current Assets” instead of “Working Capital”.
The score you receive can be analysed as follows:
- >2.6 infers that the company is considered to be “safe”.
- 1.1 – 2.6 infers that the company is experiencing “some risk” of facing financial distress.
- <1.1 infers that the company is at “serious risk” of facing financial distress.
A worked example of this model has been provided further down in this blog, using the financial statements obtained for L&M Keating.
Worked Examples
It literally took me 15 – 30 minutes to pull together
The following sub-sections show worked examples of the three versions of the z-score model provided above using financial statements obtained for:
- Carillion PLC
- an Irish Manufacturing Company, and
- L&M Keating.
Worked Example #1 – Using a Publicly Listed Company (i.e., Carillion PLC)
Carillion PLC was a multinational construction and facilities management services company based in the UK. It was liquidated in January 2018. Unfortunately, Carillion’s collapse also led to the liquidation of Sammon Construction Limited, a well-respected sub-contractor in Ireland, with the loss of over 200 jobs because of Carillion’s financial failings.
So why was Sammon Construction also affected? Back in 2016, Inspired Spaces a joint venture between Carillion and a Dutch investment fund were awarded a contract by the National Development Finance Agency (NDFA) worth €270m for the design, build and financing of schools across four Irish counties (i.e., Carlow, Meath, Wexford and Wicklow). Sammon Construction had been subcontracted by a Carillion subsidiary to work on the Inspired Spaces build for the NDFA.
It wasn’t just Sammon Construction who was affected. As you can imagine, when Carillion collapsed, it also led to delays in the completion of the much needed new schools, plus likely significant cost overruns for the Irish Department of Education and NDFA who had to source and appoint a new supplier to complete the schools project. What’s important to note is that Carillion was insolvent 16 months after the award of the NDFA contract. So, what could the NDFA have done differently?
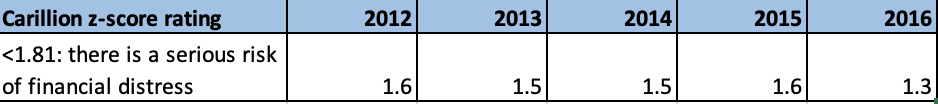
As you can see in the Z-score rating table above, Carillion’s Z-score rating was below 1.8 from 2012 – 2016, with its lowest score in 2016 of 1.3, less than one year before it was liquidated. Note, the 2016 accounts were published in early 2017.
A score below 1.8 for a publicly listed company is an indicator that the company is at “serious risk” of facing financial distress. The scariest thing from my point of view is that it literally took me 15 – 30 minutes to pull together these Z-Score figures back in 2018, since the information required is readily available.
If the NDFA had done a similar assessment, it’s clear that they would have realised the danger. As the saying goes, “an ounce of prevention is worth a pound of cure”.
Worked Example #2 – Privately Owned Manufacturing Company
A well-known and well-respected Irish Manufacturer was used for the privately owned manufacturing company Z-Score. This company is a supplier to the construction industry.
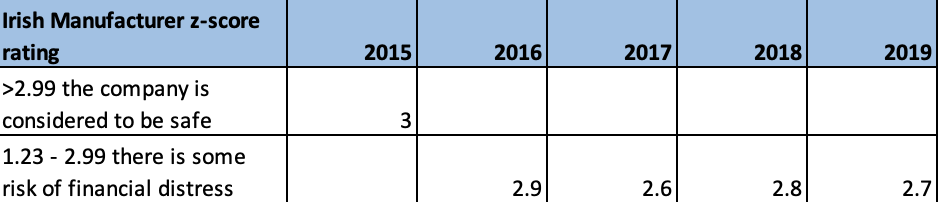
As you can see in the Z-Score rating table above the company’s score was “safe” in 2015 and since there have been some risk of financial distress. Having said that, the scores are much closer to the “safe” threshold point (2.99) than the “serious” point across all four years.
Regardless, because the company showed some sign of financial distress, a further analysis of the company’s financial performance was completed. The following reassuring financial indicators were found:
- As turnover grew by 17% between 2015 and 2019, cash in the bank grew by 55%.
- The current ratio was constantly in or around 2:1, meaning that the company was fairly liquid over the periods reviewed, since the current assets were consistently twice as large as the current liabilities.
- The quick ratio was comfortably above 1:1 throughout the years investigated, meaning that the company consistently had enough liquid assets to meet its short-term obligations. The level of liquid assets (e.g., cash and cash equivalents, accounts receivables) was consistently greater than the level of the company’s current liabilities.
- The gearing ratio was extremely low and of little to no concern, indicating that the amount of equity needed by the company to pay off its outstanding debts was low between 2015 and 2019. As a result, during that timeframe, the company would have been able to pay off all its debts quickly.
- Return on Capital Employed (ROCE) was extremely steady within a narrow range between 0.5 and 0.55, meaning for every euro of capital invested the business was generating between 50 and 55 cents of earnings before tax and interest.
In short, the financial performance of the company appeared strong. Although some risk exists, it appears to be a well-managed company. Also, because of the nature of the construction industry in which the company operates, risk is a given occupational hazard. Prudence dictates that the company’s Z-Score rating should be monitored in the future on a yearly basis. It should also be noted that this Irish Manufacturing company is still trading profitably.
Worked Example #3 – Privately Owned Non-Manufacturing Company (i.e., L&M Keating)
The L&M Keating story is a somber cautionary tale of an ambitious market leader in the marine construction sector who grew too quickly and paid the ultimate price. L&M Keating was liquidated in 2021, leaving €30 million in debts behind.
L&M Keating is a good example of why it was an important development for the Z-Score model to evolve over time to incorporate privately-owned companies and non-manufacturing companies. Using, the original Z-score model to analyse L&M Keating financial performance, the scores would have exceeded 2.99 for each year reviewed, thus indicating that the company should be considered “safe”.
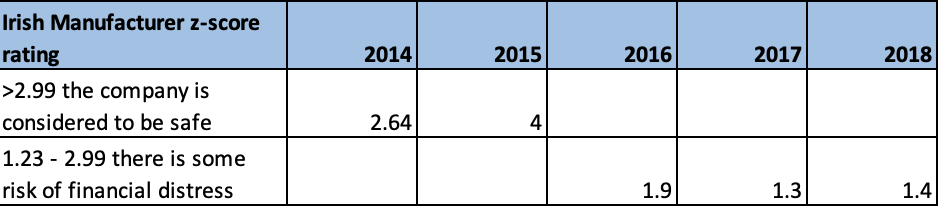
However, as you can see from the table above, the non-manufacturing Z-score calculated a “safe” score for L&M Keating only in 2014 and 2015. The score fell sharply from 2016 onwards, indicating a “serious risk” of financial distress from 2016 to 2018.
The main reason for this glaring discrepancy between the two models is that the original model includes the sales/ total assets ratio as part of its score. L&M Keating’s sales jumped from €14.8m in 2012 to €32.9m in 2014 and again to €61.2m in 2015 and steadily rising to €69.5m by 2018. The rapidly growing turnover would have helped to inflate L&M Keating’s Z-Score rating had the original model being used.
When we use the non-manufacturing Z-score model as we did above, the company’s declining working capital levels contributed to the erosion of L&M Keating’s Z-Score. L&M Keating had negative working capital from 2016 to 2018.
Although, the COVID-19 lockdown restrictions in 2020 did not help L&M Keating its financial issues could be seen as early as 2017. Although L&M Keating grew its turnover quickly through lucrative public sector contracts, it also made losses from project to project. Those losses eventually caught up with them. In doing further checks, it was also determined that L&M Keating was also late with its CRO filings for the 2017 and 2018 financial years. This is another red flag with regards to the solvency and financial credibility of a business.
Mitigating Actions
The Z-Score rating of suppliers and buyers is a good financial due diligence exercise as long as it is done on a continuous basis (at least annually).
It is worth noting that there are other steps you can take to help mitigate against the overdependence on a limited number of suppliers and buyers. Some of these mitigating actions include the following:
- Use the Z-score model with other financial ratios such as current ratio, quick ratio, gearing ratio and ROCE.
- Adopt good debt and credit management policies and procedures.
- Build resilience in your supply chain so that you are not overly reliant on one supplier.
You can use competitive tendering and other techniques to build supplier options. - Diversify your customer base and use smart data to help you to find new suitable sales targets, e.g., in new industry sectors and/or domestic and overseas markets.
Remember, send us a message to info@keystonepg.ie if you would like to discuss how this can help your organisation.
This article was first posted on Sluamor.com and was drafted by Joe O’Regan, a chartered accountant.